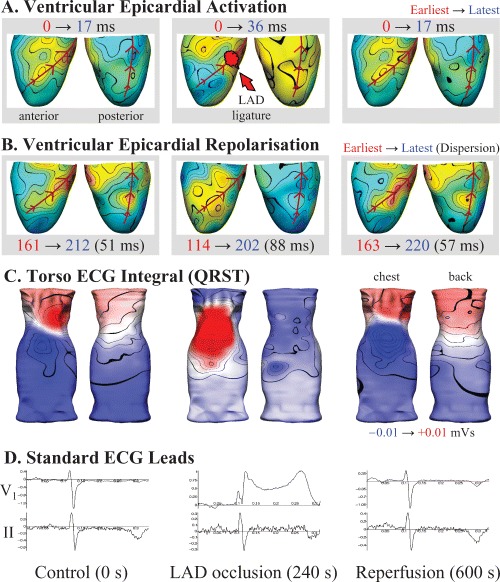
Figure 2.

Concurrent epicardial and torso ECG activity before (left), following 4 minutes of total left anterior coronary artery (LAD) occlusion (middle), and after 6 minutes of reperfusion (right) in an anesthetized pig. (A) Epicardial activation sequence mapping highlights the region of slowed conduction (blue) distal to the LAD snare during occlusion, while repolarization (B) was earliest (red) in the same region, consistent with the known effects of ischemia on the cardiac action potential. (C) Body surface QRST integral mapping highlighted a marked region of abnormal positivity adjacent to the ischemic portion of the heart, consistent with the ST segment elevation seen on the standard precordial lead‐V1 (D), while lead‐II showed relatively little change during the entire protocol.
