
Figure 1.
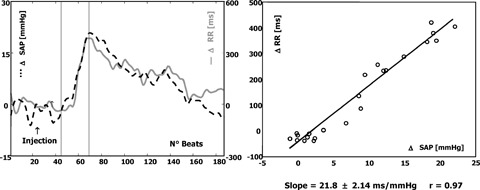
Example of a normal BRS. On the left, beat‐to‐beat changes in systolic arterial pressure (SAP) (dotted line) and in RR intervals (solid line) with respect to baseline value are reported. Analysis is performed from the beginning to the end of the increase in SAP with the attendant changes in RR interval (points included between vertical marks). These points are used for calculation of the regression line (on the right). The increase in SAP, >20 mmHg, is associated with an increase in RR interval of about 400 ms. The calculated slope is 21.8 ms/ mmHg increase in SAP. Such a slope identifies a baroreceptor response characterized by a prevailing increase in vagal efferent neural traffic to the sinoatrial node.