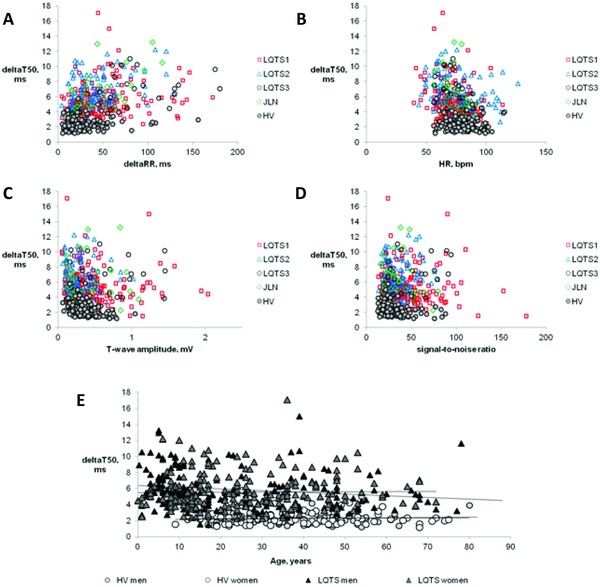
Figure 2.

Individual values of deltaT50 during the day plotted versus the corresponding deltaRR interval (Panel A), heart rate (HR, Panel B), T‐wave amplitude (Panel C), and signal‐to‐noise ratio (Panel D) in healthy volunteers (HV) and patients with different types of long QT syndrome, LQTS1, LQTS2, LQTS3, and JLN. Panel E shows deltaT50 plotted against age for the male and female HV and male and female patients with LQTS, together with the regression lines for the respective group of subjects.
