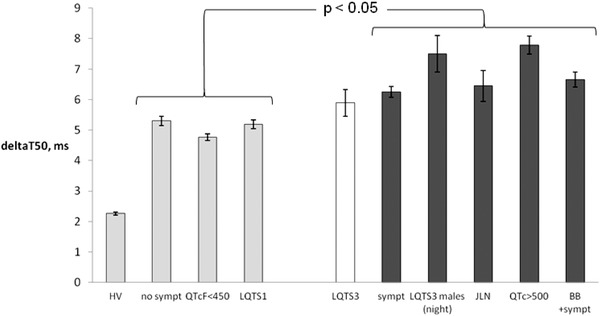
Figure 4.

DeltaT50 for the subgroups with lower risk of cardiac events; healthy volunteers (HV), asymptomatic LQTS patients (no sympt), LQTS patients with QTcF <450 ms (QTcF < 450 ms) and patients with LQTS1 (LQTS1) compared to the subgroups with higher risk of cardiac events; patients with LQTS3 (LQTS3), symptomatic LQTS patients (sympt), male LQTS3 patients at night (LQTS3 males (night), patients with JLN (JLN), LQTS patients with QTcF >500 ms (QTcF > 500 ms) and LQTS patients with symptoms during treatment with beta‐blocker (BB + sympt). The groups with dark gray bars, that is, all high‐risk groups except for the patients with LQTS3, had significantly higher deltaT50 than the groups illustrated by light gray bars, that is, the low‐risk groups. Shown are mean ± SEM.
