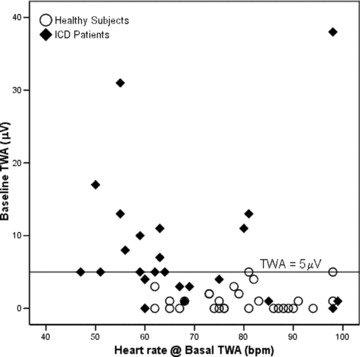
Figure 3.

Baseline T‐wave alternans (TWA) scatter plot of amplitude (μV) versus heart rate (bpm) for implantable cardioverter‐defibrillator (ICD) patients (filled diamonds) and control group (open circles). ICD patients (5 out 32) and healthy subjects (3 out 31) with indeterminate baseline TWA values are not depicted. A reference line at the TWA amplitude of 5 μV was added for clarity (see text for details).
