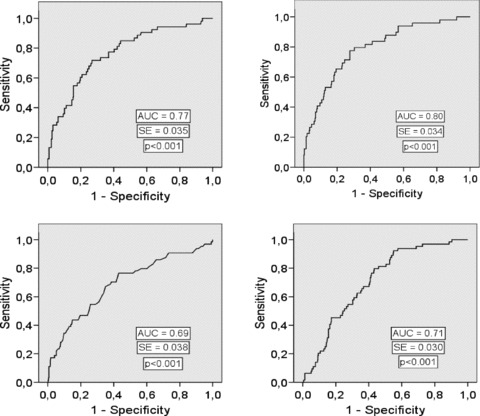
Figure 2.

Receiver operator characteristics (ROC) curve for the brain natriuretic peptide (BNP) (upper left chart), the ratio of BNP to the standard deviation of all normal to normal intervals (SDNN) (upper right chart), the short‐term scaling exponent α1 (Alpha1) (lower left chart), and the turbulence slope (TS) (lower right chart) in predicting heart failure hospitalization during the follow‐up. AUC = area under the curve, SE = standard error.
