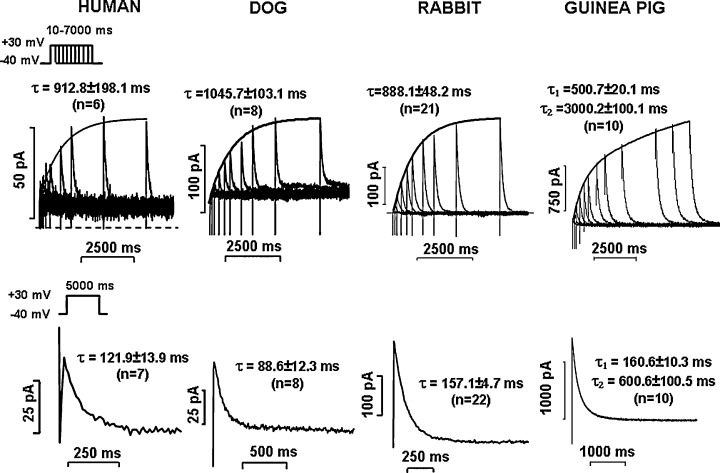
Figure 3.

The activation (upper panels) and deactivation (bottom panels) kinetics of IKs in human, dog, rabbit, and guinea pig ventricular myocytes. Currents were measured with patch‐clamp technique as described in 12, 16, 49, and 59. Activation kinetics was studied by applying the envelope of tails protocols (see inset) from the holding potential of −40 mV. Insets show the value of activation or deactivation time constants (τ) determined by fitting the activation and deactivation curves with exponential functions. n = number of experiments. (Unpublished results from the present authors.)
