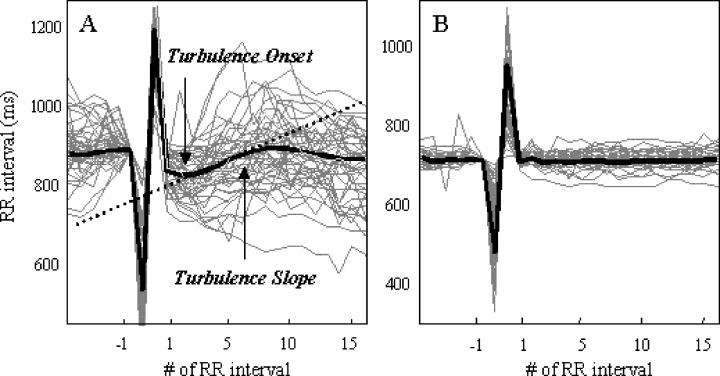
Figure 1.

Normal and abnormal HRT tachograms. Gray lines: R‐R interval values from a Holter recording, plotted versus beat number, using the VPC to align them. Black line: Averaged tachogram. Healthy (left) and abnormal (right) responses. Turbulence onset (TO) quantifies the shortening of R‐R interval after the VPC, turbulence slope (TS), the slope of the lengthening of R‐R interval after the VPC.
