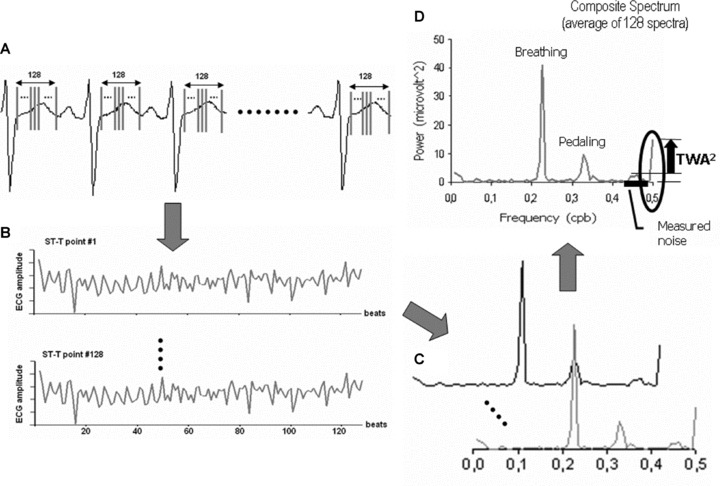
Figure 1.

The four main steps of the SM methodology. (A) Selection of 128 equally spaced points in the ST‐T complex of a 128‐beat ECG stream. (B) Graphical descriptions of the amplitude variation along the 128 beats from ST‐T point 1 to ST‐T point 128 (128 tachograms). (C) Each tachogram has its spectrum computed by the Fourier Transform, in a total of 128 spectra. (D) All 128 spectra are averaged to create a composite spectrum. From this composite spectrum, the alternans power is computed as the power at 0.5 cpb minus the average noise power measured. The correspondent TWA amplitude is the square root of the alternans power.
