
Figure 11.
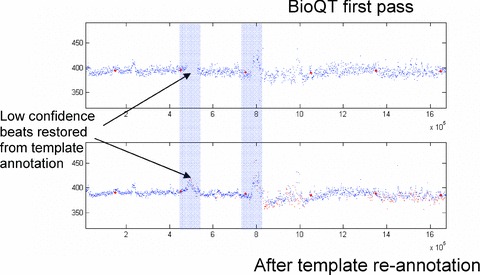
BioQT analysis of moxifloxacin 24‐hour Holter recording. The upper trace shows the first‐pass analysis of QT interval values, with missing beats (due to low confidence) in the two shaded sections. After the cardiologist has reannotated the templates from these sections, each beat is automatically reannotated and its QT interval measurement is reinserted into the interval time‐series, as shown in the lower trace.