Figure 2.

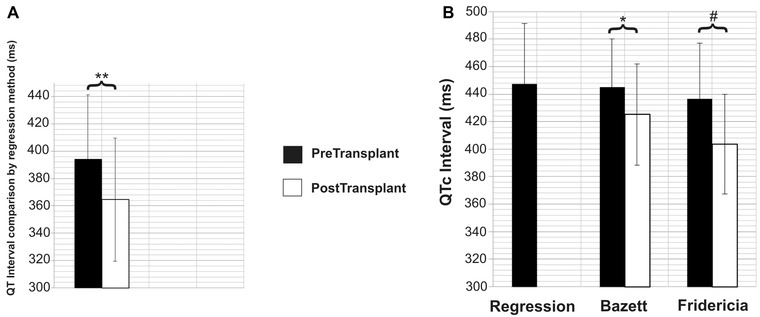
(A) Comparison of pre‐ and post‐OLTx absolute QT intervals calculated using the regression method at RR interval (750 ± 144 ms, i.e., the HR of the post‐OLTx ECG). The absolute QT interval shortens significantly post‐OLTx.
(B) Comparison of pre‐ and post‐OLTx QT intervals corrected with various methods (for RR interval 1000 ms, i.e., HR 60 bpm). There is no significant difference between the pre‐OLTx QTc calculated by the three different methods. Both QTcB and QTcF shorten significantly post‐OLTx.
Note: The error bars represent standard deviation.
*P < 0.01, **P < 0.002, #P < 0.0001.
