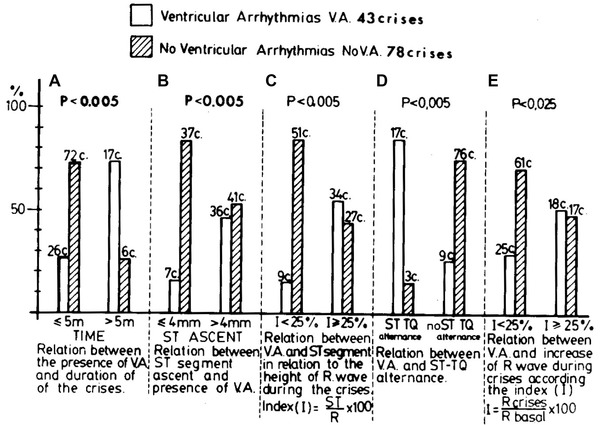
Figure 6.

Relationship between the presence of ventricular arrhythmia and the duration of the attacks (< and >5 m) (A), the ST‐elevation isolated (≤ or ≥ 4 mm) (B), and in relation to the R Clinical ECG wave (C), the presence or not of ST_QT alternans (D), and the modification of the R Clinical ECG wave in relation to the basal R Clinical ECG wave (E). Each bar graph represents one characteristic of the crises. The calculations included all the attacks that showed that characteristics.
