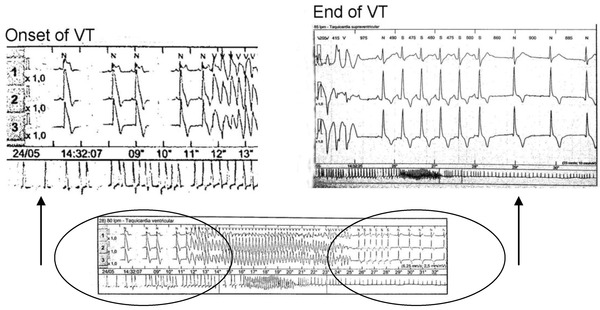
Figure 9.

In the lower part, a crisis lasting 13 s. is shown. In the upper part the amplified onset at end of the run is recorded. See after the end of ventricular tachycardia just from the first sinus complex a very evident deep negative T wave of reperfusion, that last only several minutes.
