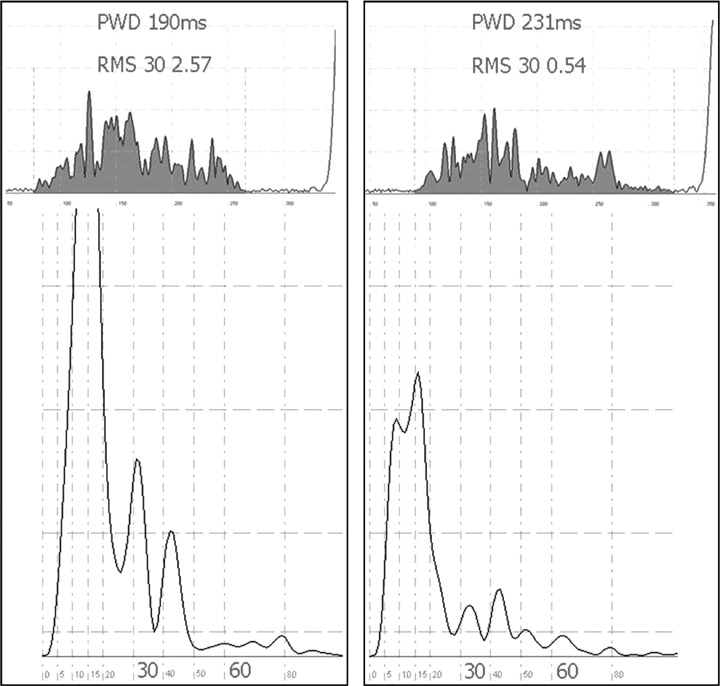
Figure 2.

Representative sample of time domain and frequency domain results before and after wide area circumferential ablation as depicted in Fig. 1. The left panel shows the filtered P wave before and after ablation, respectively, above the corresponding frequency domain analysis. P wave duration increases and overall magnitude decreases after ablation. This is quantified in the frequency domain (below). The power within the spectrum can be seen to be reduced after ablation. This is quantified into energy bands: P30 represents 30–150 Hz; P60 represents higher frequencies between 60 and 150 Hz. The time domain X‐axis is in micro volts (μV); each large square represents 50 ms on the Y‐axis. The frequency domain X‐axis represents frequency in Hertz (Hz); the Y‐axis is in micro volts squared (μV2).
