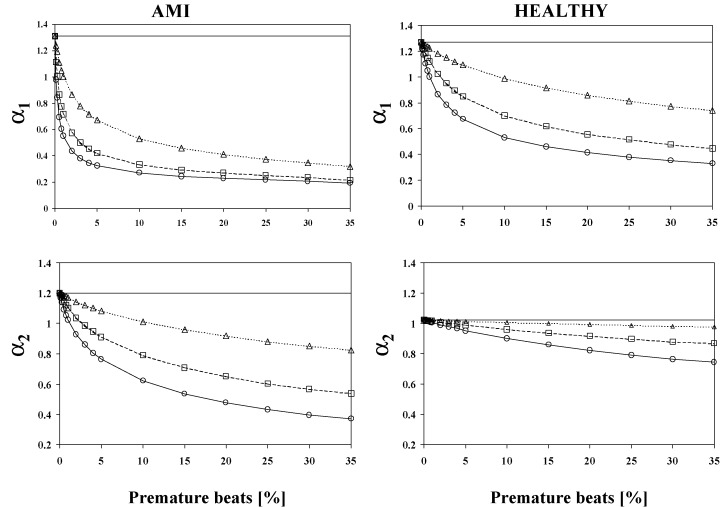
Figure 2.

Effects of the artificial premature beats on fractal scaling analysis in post‐AMI patients and healthy subjects. Mean values of the α1 and α2 analyses are in function of the amount of the premature beats. α1 and α2 indicate the scaling exponents analyzed by detrended fluctuation analysis from short and intermediate time windows respectively. The symbols indicate following prematurity: ——= original (0% premature beats), ––= 30% prematurity, ‐ ‐ ‐‐ ‐ ‐ = 20% prematurity, and ‐ ‐ ‐‐ ‐ ‐ = 10% prematurity.
