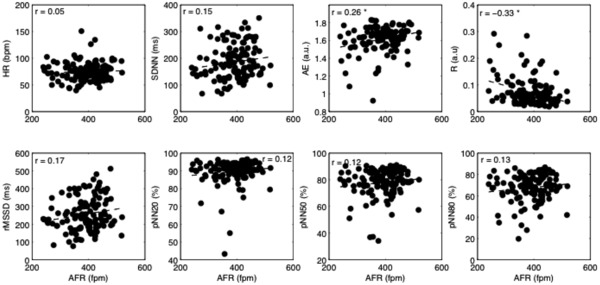
Figure 1.

Scatterplots of heart rate variability and irregularity parameters versus AFR for all patients; the linear fitting is superimposed (dashed line). Values of Person's correlation are shown in each subplot. AFR = atrial fibrillation rate; HR = ventricular rate; SDNN = standard deviation of all normal RR intervals; rMSSD = the root of the mean squared differences of successive RR intervals; pNN20, pNN50, pNN80 = the percentage of interval differences of successive RR intervals greater than 20ms, 50ms and 80ms; ApEn = approximate entropy; R = regularity index. *P < 0.05.
