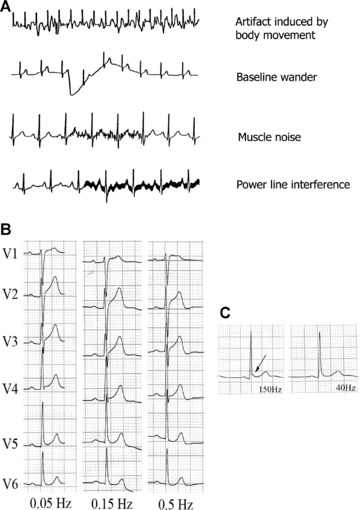
Figure 11.

(A) Examples of artifacts caused by different circumstances. (B) Effect on the ST segment on manually applying three different low‐frequency filters to precordial lead signals, in a healthy patient with early repolarization. A striking elevation of the ST segment is observed in V1 and V2 on applying the 0.5 Hz filter, but not when the standard recommended filter (0.05 Hz) is applied. (C) Lead V5 in a healthy 23‐year‐old man with early repolarization. The J wave is visible on applying the low‐pass filter at 150 Hz (arrow), but this disappears on reducing the frequency to 40 Hz.
