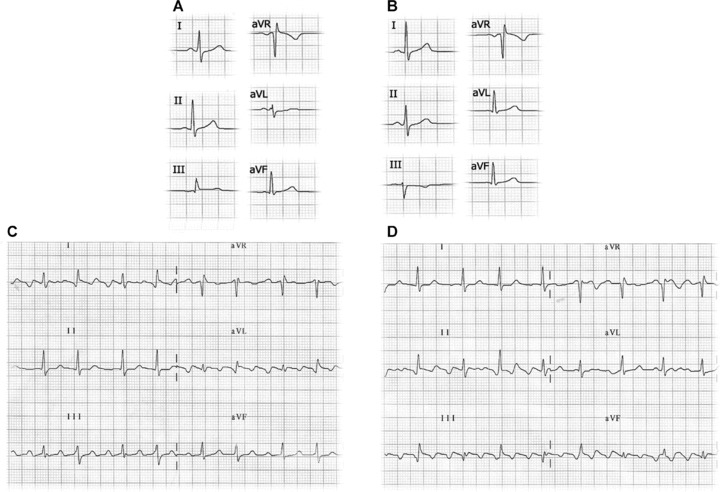
Figure 4.

(A) Electrocardiogram recorded with left leg–left arm electrode interchange. In this case, the P axis has a left shift with a P wave in lead I and aVL amplitude greater than in lead II. In lead III, a negative P wave is recorded followed by a QRS complex with dominant R. (B) Electrocardiogram of the same patient with correctly placed electrodes with P axis at 60°. (C) Left leg–left arm electrode interchange in a patient with atrial flutter: the ECG shows the typical saw tooth morphology in lead III and aVF but not in II. (D) Electrocardiogram of the same patient with correctly placed electrodes.
