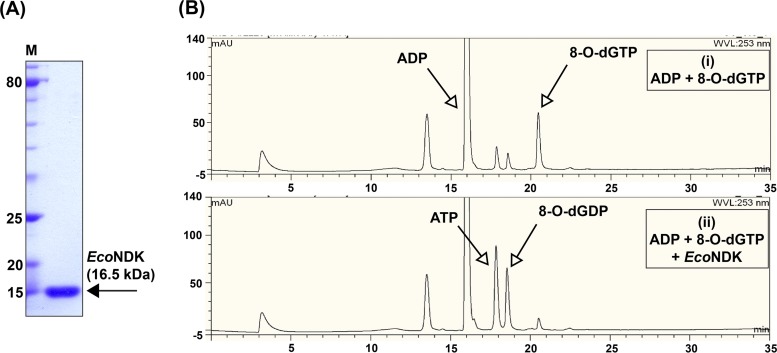
FIG 1.
Purification of EcoNDK from the E. coli mutT null strain and activity analysis on 8-O-dGTP. (A) Representative 15% SDS-PAGE gel showing the purity and migration of the purified EcoNDK. M stands for the protein size markers. (B) Chromatograms indicate NDK-catalyzed reaction on 8-O-dGTP. Reaction analytes were separated on a DNAPac column through high-performance liquid chromatography (HPLC), using a gradient of 1 M LiCl (0% to 40%). The retention times of different analytes are shown on the x axis and the corresponding peak intensities (given in arbitrary units) are shown on the y axis. (i) Control. Shown is the migration profile of ADP and 8-O-dGTP. (ii) Reaction in the presence of NDK. Shown is the emergence of ATP and 8-O-dGDP peaks due to NDK-mediated transfer of terminal phosphate from 8-O-dGTP to ADP.

