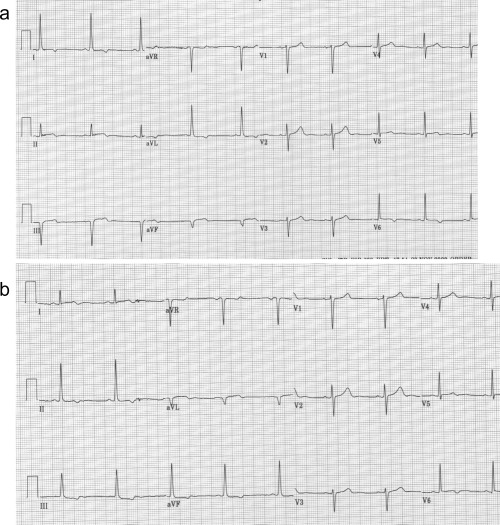
Figure 3.

(a) Electrocardiogram on the second day with the leads connected appropriately showing sinus rhythm with Q waves, residual ST elevation and negative T waves in the inferior leads and lead V6, and ST depression in I and aVL. (b) Electrocardiogram obtained after reversing the left arm and left leg electrodes. The QRS axis has changed. There is now Q wave in leads I and aVL with residual ST elevation, ST elevation in lead V6, and ST depression in the inferior leads.
