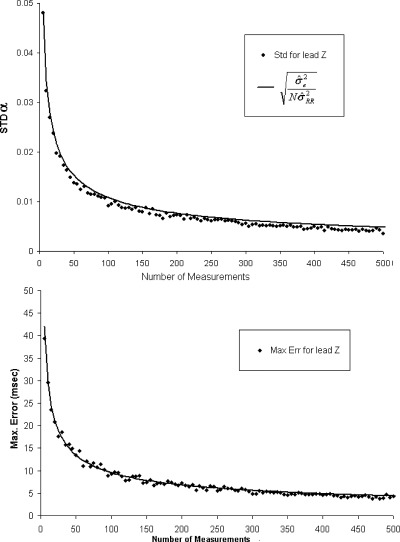
Figure 1.

Curves describing the variation of stability (STDα) in upper panel and the variation of Max. Err. in the lower panel for lead Z, according to the number of points included in the design of the correction model. These graphs rely on the models designed with measurements spreading in a similar manner on the overall heart‐rate ranges (equal variance on heart‐rate range for all experiment). These curves follow the expected theoretical  pattern (bold line).
