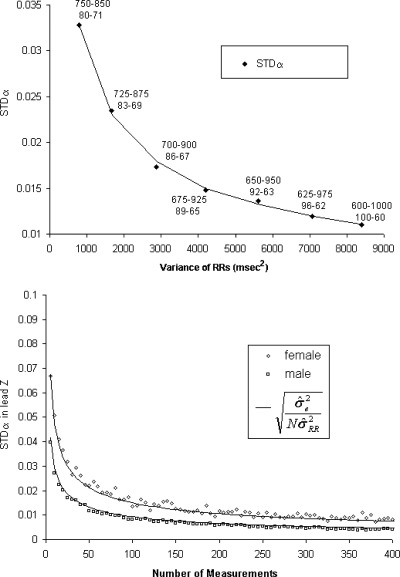
Figure 2.

The upper panel is the evolution of stability of the slope of the linear correction model according to the R‐R ranges (expressed as the variance of the R‐Rs). Each point is labeled using the corresponding heart‐rate ranges expressed in both R‐R (ms) and HR (bpm). The smaller the R‐R variance, the less stable the correction model is. The lower panel describes the values of STDα in lead Z between genders.
