Figure 1.

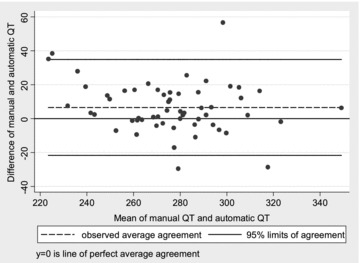
Scatterplot of difference versus average between manual QT measurements and automatic measurements, with 95% limits of agreement. There is a small systematic bias with manual measurements being longer than the automatic measurements.

Scatterplot of difference versus average between manual QT measurements and automatic measurements, with 95% limits of agreement. There is a small systematic bias with manual measurements being longer than the automatic measurements.