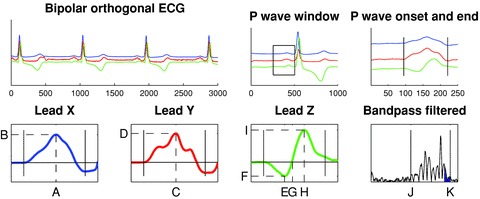
Figure 1.

Schematic illustration of the signal‐averaged P‐wave analysis. Bipolar orthogonal‐lead ECG data were analyzed. QRS complexes were included and averaged according to similarity. P waves were extracted using 250‐ms long signal windows preceding each QRS complex. The P‐wave onset and end were set manually. The derived parameters are indicated by dashed lines in the right panels. Lead X (blue): Xmax location (A) and amplitude (B); Lead Y (red): Ymax location (C) and amplitude (D); Lead Z (green): Zmin location (E) and amplitude (F), Zzero location (G), Zmax location (H) and amplitude (I). Based on these parameters the morphology is classified into one of three predefined classes using an automated algorithm. Finally, bandpass filtering (40–250 Hz) was performed to estimate filtered P‐wave duration (J and K, respectively) and RMS20 (blue area).
