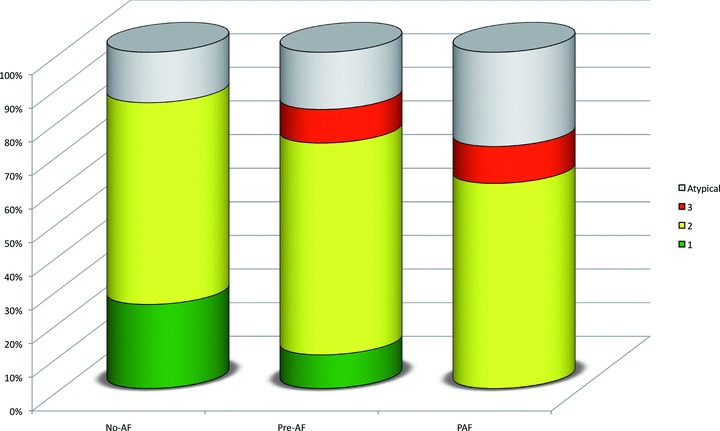
Figure 2.

Bar graph illustrating the distribution of P‐wave morphologies at baseline in patients without a history of AF who did not (No‐AF) and did (Pre‐AF) develop AF during the study and patients with a history of atrial fibrillation who did suffer relapse during the study (PAF). Notably, Type 1 P‐wave morphology was more abundant in the No‐AF group, whereas Type 3 P‐wave morphology was only seen in patients who developed AF during the study. The differences in P‐wave morphology between the study groups were statistically significant (P = 0.03, chi‐square test).
