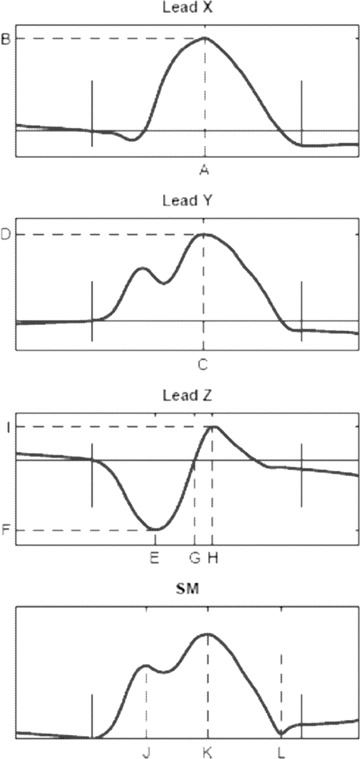
Figure 1.

Schematic illustration of the signal‐averaged P‐wave morphologies. The derived parameters are indicated with dashed lines. Lead X: Xmax location (A) and amplitude (B); Lead Y: Ymax location (C) and amplitude (D); Lead Z: Zmin location (E) and amplitude (F), Zzero location (G), Zmax location (H) and amplitude (I); Spatial magnitude (SM); location of the maximum peak (SM1) (J) and the negative extreme (Nadir) (L). If a second peak was identified (SM2) (K), its location and distance to SM1 were calculated.
