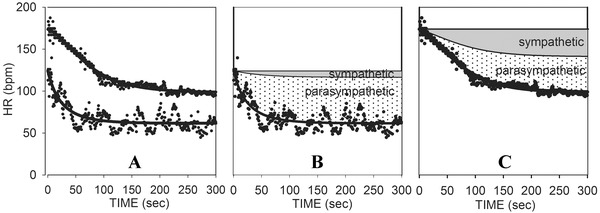
Figure 5.

(A) Curve fits of HRR from both maximum and 50% exercise for a fit subject. (B) Curve fit for 50% exercise, with the reconstructed curves showing the net changes resulting from parasympathetic reactivation and sympathetic withdrawal. (C) Curve fit for maximum exercise, with reconstructed curves showing the net changes resulting from parasympathetic reactivation and sympathetic withdrawal.
