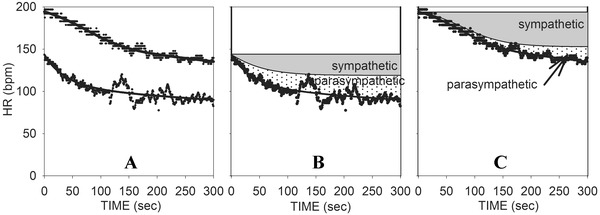
Figure 6.

(A) Curve fits of HRR from both maximum and 50% exercise for a sedentary subject. (B) Reconstructed curves for 50% exercise showing the net changes due to parasympathetic reactivation and sympathetic withdrawal. (C) Reconstructed curves for maximum exercise showing the net changes due to parasympathetic reactivation and sympathetic withdrawal.
