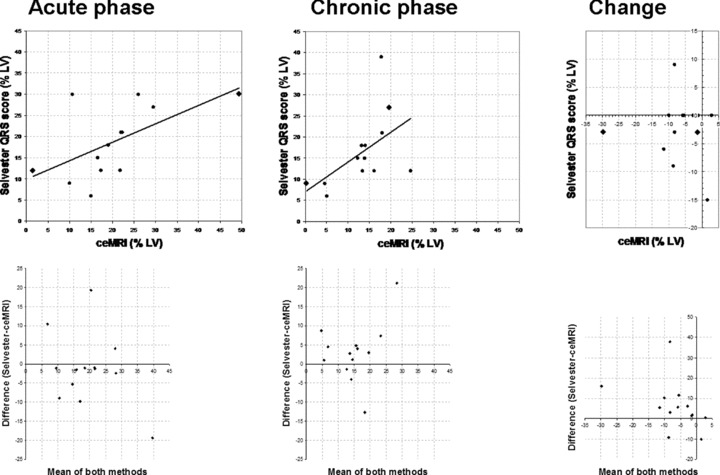
Figure 3.

Top: correlation between infarct size measurements by the Selvester QRS score and contrast‐enhanced MRI (ceMRI) in the acute (left) and chronic phases (mid) after acute myocardial infarction, and the change (right) between these two measurements. The two patients with the largest time intervals between ceMRI and ECG are depicted as a diamond. Bottom: Bland‐Altman plots of these correlations.
