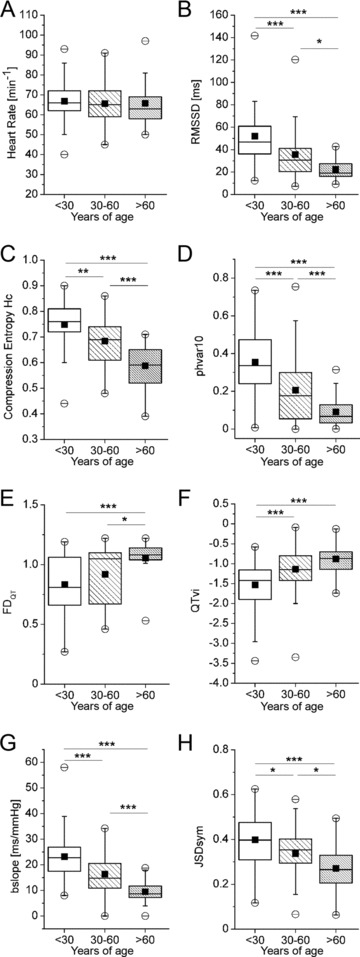
Figure 1.

Comparison of cardiovascular autonomic parameters between different age groups. (A) Heart rate. (B) Root mean squared differences of successive normal‐to‐normal intervals (RMSSD). (C) Compression Entropy Hc. (D) Probability of high variability sequences with a time limit of 10 ms (phvar10). (E) Fractal dimension of QT interval time series (FDQT). (F) QT variability index (QTvi). (G) Bradycardic slope of baroreflex (bslope). (H) Joint symbolic dynamics of symmetric baroreflex‐like words (JSDsym). Data presented as box plots. Boxes indicate 25th and 75th percentile with the horizontal line indicating the median. ▪ mean. ○ 1st and 99th percentile. – minimum and maximum of data. *P < 0.05; **P < 0.01; ***P < 0.001.
