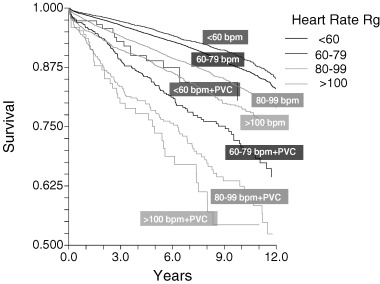
Figure 2.

Kaplan–Meier cumulative survival curves demonstrate decreasing survival with increasing heart rate among patients without PVCs and more significant declines in survival in those with PVCs. The curves followed a consistent order with increasing mortality with increasing rate and with the matching color coded line with PVCs exhibiting an increased mortality. PVC = premature ventricular contraction.
