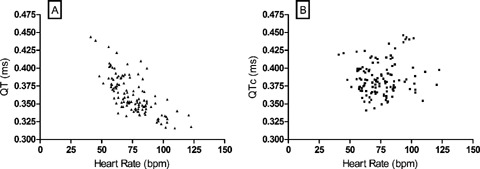
Figure 2.

Subject‐specific QT‐interval correction. Uncorrected QT and corrected QTc data of 30 subjects obtained in four mental stress periods are plotted against heart rate. In panel A, a highly significant correlation is present between the uncorrected QT time and heart rate (r =–0.7132, P < 0.0001). In panel B, as a result of the subject‐specific correction method, QTc and heart rate do not correlate (r = 0.1144, P = 0.2136, ns).
