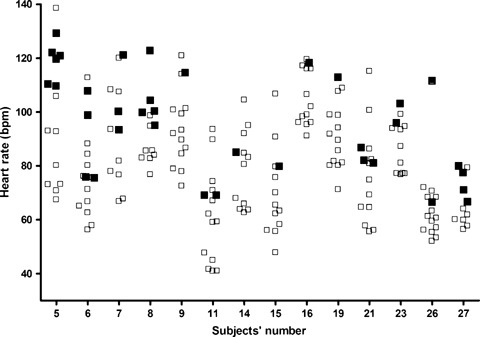
Figure 3.

This graph illustrates the heart rates for 14 (out of the 30) participants who have developed bifid T waves during at least one study period. Open squares indicate normal T waves; filled squares indicate bifid T waves. Although bifid T waves seem to appear at higher heart rates, this observation cannot be the only explanation.
