
Figure 2.
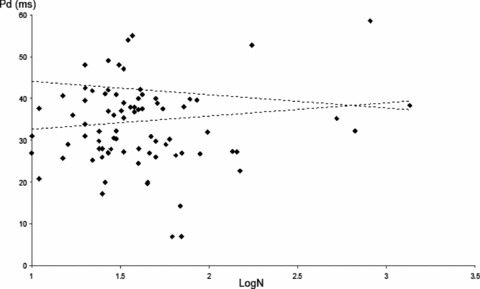
Pd values compared with logarithmic scale of number of participants (N). The funnel‐like scattered lines represent the expected 99% confidence interval of Pd values according to the biggest scaled study. Only 29 groups were found in the expected zone (33.7% of the study groups).