
Figure 2.
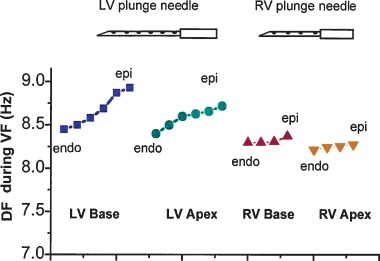
Mean transmural DF distribution in a pig during the first 5 seconds of VF. Each data point represent the mean DF at plunge needle electrodes with the most endocardial (endo) electrode to the left and the most epicardial (epi) electrode to the right for the four regions (LV base, LV apex, RV base, and RV apex). In all four regions, the electrodes near the epicardium had a higher frequency, suggesting a faster activation rate, than the electrodes near the endocardium.