
Figure 4.
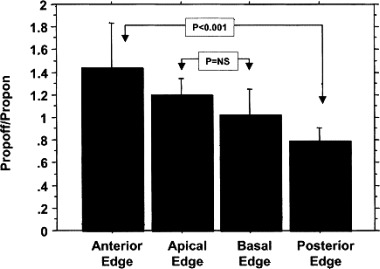
Propoff/propon ratios for the four edges of the mapped region. Wavefronts tended to enter posteriorly and leave anteriorly. Mean ± 95% confidence intervals are shown. P < 0.001 indicates statistical significance; P = ns indicates no statistical significance (used with the publisher's permission). 8