
Figure 5.
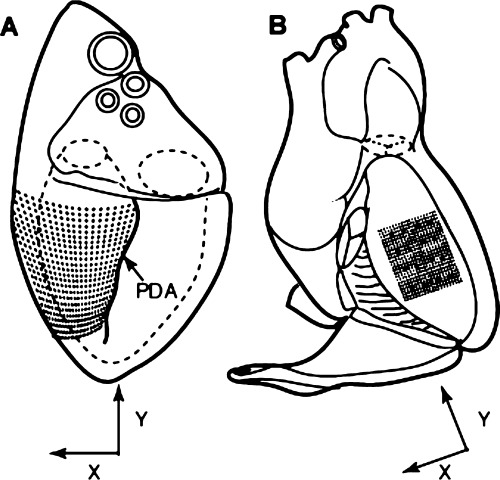
Diagrams of the heart indicating the location of the mapping electrodes on the LV (A) and the right side of the septum (B). The black dots represent the individual plaque recording electrodes while the 16 stars represent the locations of the plunge needle electrodes. The directions of the x and y components of the conduction velocity vectors of the VF wavefronts are also indicated. PDA = posterior descending coronary artery (used with the publisher's permission). 50