
Figure 6.
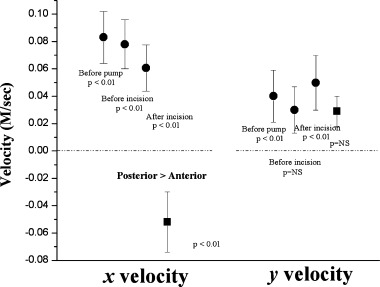
Mean x and y components of the velocity vectors for VF wavefronts in the LV (circles) and septum (squares). The mean ± 95% confidence intervals in m/s are shown. P values represent the probability that the mean velocity is different than 0 (used with the publisher's permission). 50