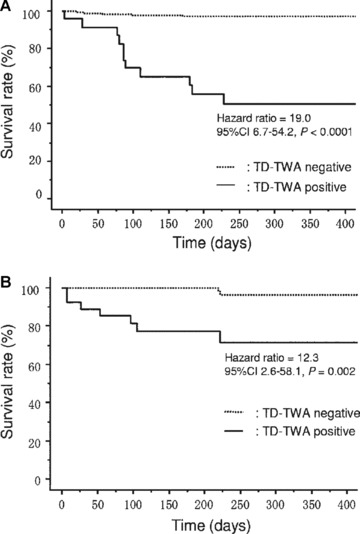
Figure 2.

Event‐free curves for cardiac mortality using maximal voltage of time‐domain T‐wave alternans (TD‐TWA) from 24‐hour Holter ECGs in ischemic (A) and nonischemic (B) study subgroups. 37 TWA was analyzed by the Modified Moving Average method. (Reprinted with permission from Elsevier, Inc.)
