Figure 3.

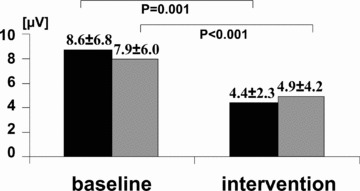
Changes in T‐wave alternans (TWA) amplitude following drug administration in patients with d,l‐sotalol (dark bars) and metoprolol (gray bars). 39 TWA was measured by the Spectral Method. (Reprinted with permission from Elsevier, Inc.)

Changes in T‐wave alternans (TWA) amplitude following drug administration in patients with d,l‐sotalol (dark bars) and metoprolol (gray bars). 39 TWA was measured by the Spectral Method. (Reprinted with permission from Elsevier, Inc.)