
Figure 2.
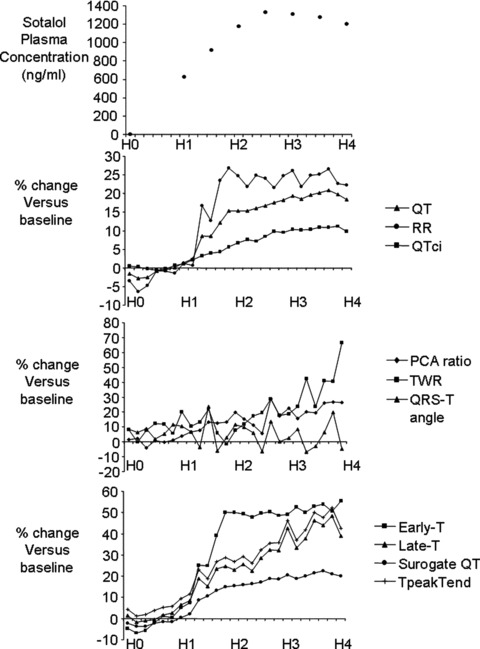
Upper panel: time course of sotalol concentration after single‐dose administration (160 mg). Lower panels: sotalol effects on ventricular repolarization biomarkers expressed as a percentage change relative to the baseline period. H0 to H4: time after sotalol administration in hours (H).