
Figure 3.
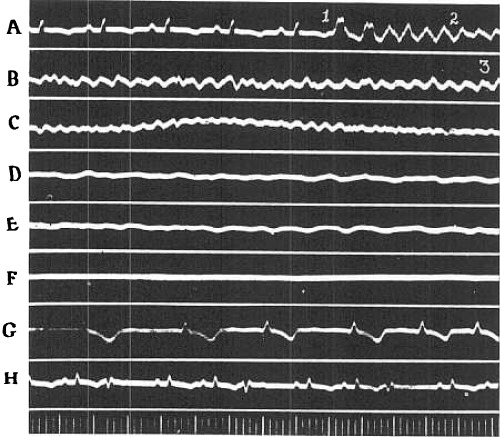
Segments of electrocardiogram (Lead II). showing the early stages of natural fibrillation, the effects of KCl and of revival following use of CaCl2 (O‐42). A, control and initial tachysystolic stage; B, coarse incoordination, minutes later; C, tremulous incoordination after 2 minutes; D, 2 minutes; after use of KCl; E, 12 minutes after; F, minutes; after; G, initial idioventricular beats, recorded 19 minutes after fibrillation first started; H, 30 minutes after record; H. Time 0.04 and 2 seconds.