
Figure 1.
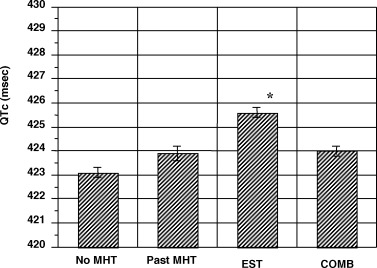
Comparisons of QTC intervals (using Bazett's correction) in four menopausal hormone therapy groups. The figure shows QTC intervals after adjustments for covariates. Subjects taking unopposed estrogen therapy had a QTC interval that was longer than that in the three other groups (P < 0.05). Data are shown as mean ± SEM. COMB = combine estrogen and progesterone use; EST = estrogen use alone; MHT = menopause hormone therapy.