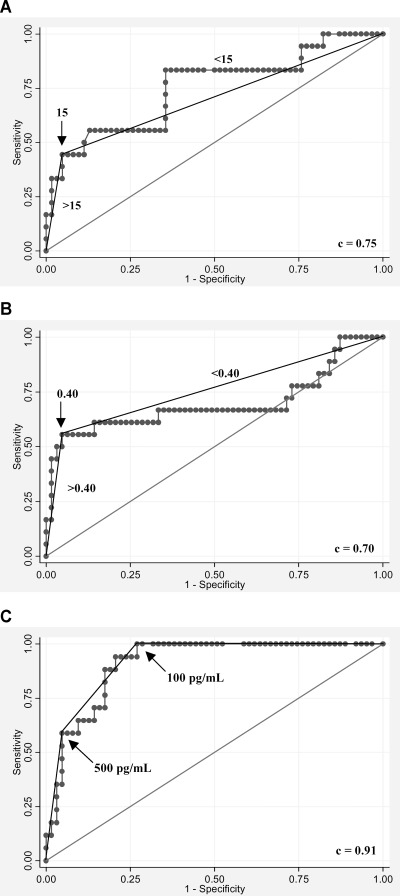
Figure 2.

The receiver operating curves are shown for the systolic time intervals and B‐type natriuretic peptide for the diagnosis of left ventricular dysfunction: (A) electromechanical activation time (EMAT; Q‐S1), (B) electromechanical activation time divided by left ventricular systolic time (EMAT/LVST), and (C) B‐type natriuretic peptide (BNP). Arrows indicate chosen cut‐points.
