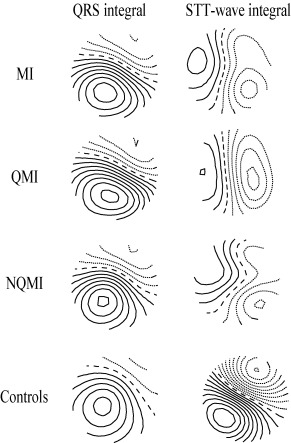
Figure 3.

The group mean QRS integral and ST‐T wave integral MFMs. From top to bottom: the whole myocardial infarction patient group (MI), the Q wave myocardial infarction subgroup (QMI), the non‐Q wave myocardial infarction subgroup (NQMI), and the healthy controls (controls). The QRS integral maps of all patient groups resemble the map of the controls. On the contrary to QRS maps, the ST‐T wave integral maps show much more variation in between all the MI groups and the controls. The step between two isocontour lines is 100 pT. Positive values are denoted by solid lines, negative values by dotted lines, and zero field line by dashed line.
