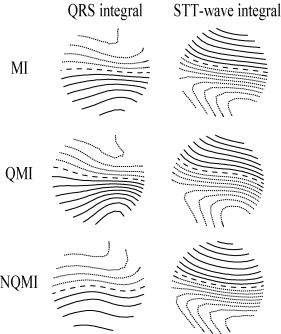
Figure 4.

QRS integral and ST‐T wave integral departure maps. From top to bottom: the whole myocardial infarction patient group (MI), the Q wave myocardial infarction subgroup (QMI), and the non‐Q wave myocardial infarction subgroup (NQMI). In the QRS integral departure maps the MI groups had larger positive values over the inferior part and smaller negative values over the superior part of the mapping region than the controls. In contrast, in the ST‐T wave integral departure maps the MI groups had larger smaller negative values over the inferior part and larger positive values over the superior part of the mapping region than the controls. The step between two isocontour lines is 0.25. Positive values are denoted by solid lines, negative values by dotted lines, and zero line by dashed line.
