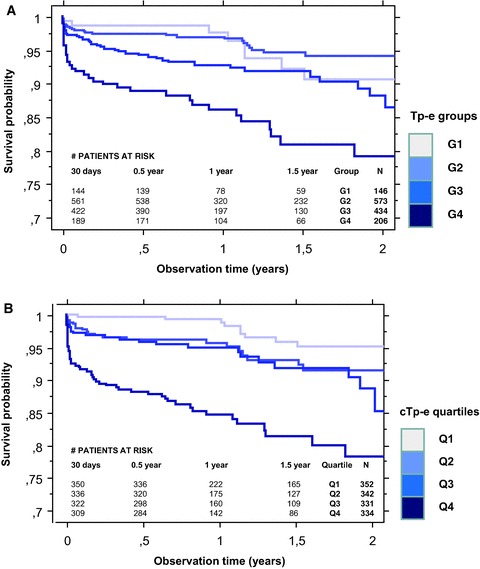
Figure 2.

(A) Kaplan–Meier plot of cumulative survival post‐AMI among patients in groups G1–G4 with heart rate uncorrected Tp‐e 60–90 ms (G1, n = 146), 100–110 ms (G2, n = 573), 120–130 ms (G3, n = 434), and ≥140 ms (G4, n = 206). (B) Kaplan–Meier plot of cumulative survival post‐AMI among patients in quartiles Q1–Q4 of increasing heart rate corrected Tp‐e (cTp‐e) (Q1; ≤105 ms, Q2; 106–120ms, Q3; 121–136ms, Q4; ≥137 ms).
