
Figure 3.
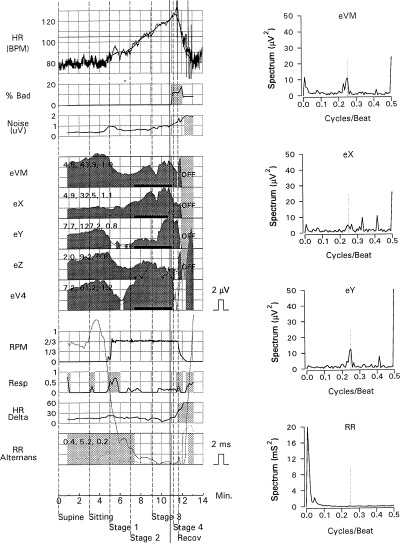
Positive t‐wave alternans analysis in an apparently healthy person without arrhythmic events during follow‐up. Alternans analysis during symptom‐limited bicycle ergometry for leads VM, X, Y, Z, and V4 is shown on the left side. The t‐wave spectrum during exercise testing with a distinct peak at a 0.5 cycle/beat frequency is shown on the right side. The dark shaded areas with black bars for each lead also indicate positive microvolt t‐wave alternans during exercise in this person. HR, heart rate trend; % bad, percentage of beats more than 10% premature; noise, mean noise in lead VM; RPM, bicycle ergometer pedaling rate; resp, respiratory frequency; HR delta, the difference between the highest and lowest instantaneous heart rates for a 128‐consecutive beat interval; R‐R alternans, the amplitude of R‐R interval alternans.