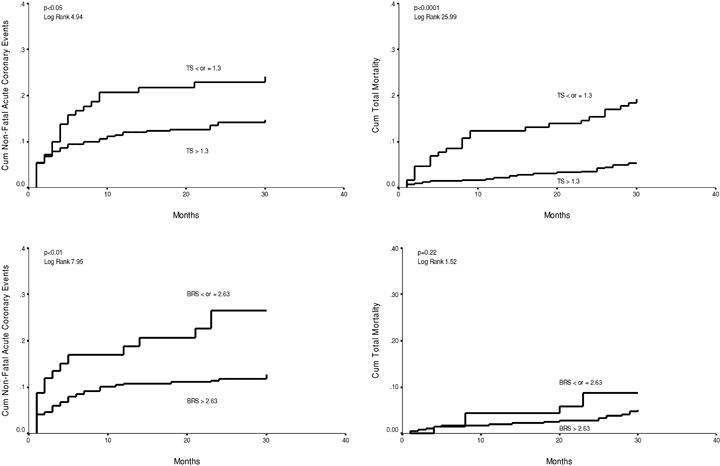
Figure 2.

Cumulative proportional probability of nonfatal acute coronary events for patients with the turbulence slope (TS) ≤ or > 1.3 ms/NN (upper left chart), for patients with the baroreflex sensitivity (BRS) ≤ or > 2.63 ms/mmHg (lower left chart). Cumulative proportional probability of all‐cause mortality for patients with the turbulence slope (TS) ≤ or > 1.3 ms/NN (upper right chart), for patients with the BRS ≤ or > 2.63 ms/mmHg (lower right chart).
