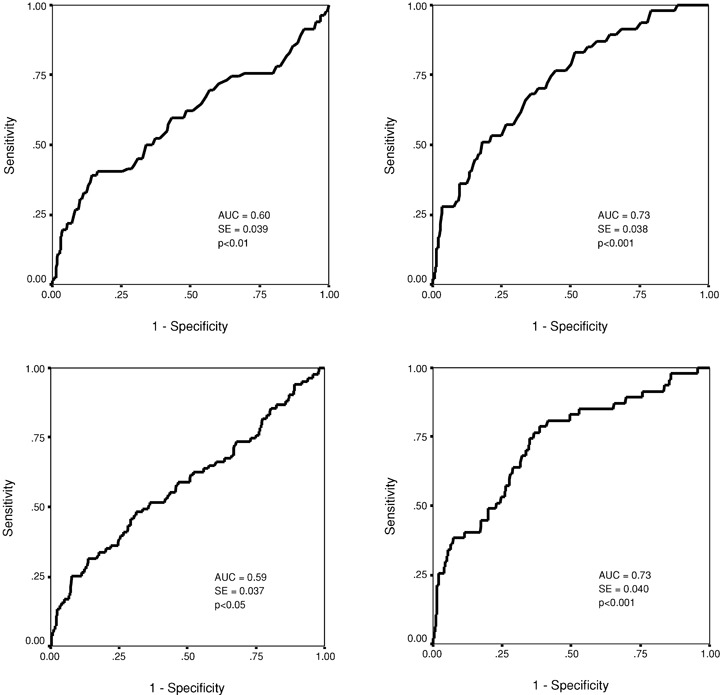
Figure 3.

Receiver operator characteristics (ROC) curve for the short‐term scaling exponent α1 in predicting nonfatal acute coronary events (upper left chart) and all‐cause mortality (upper right chart). The ROC curve for the power‐law slope β in predicting nonfatal acute coronary events (lower left chart) and all‐cause mortality (lower right chart). AUC = area under the curve; SE = standard error.
